
Some 18 months after the World Health Organization (WHO) declared the coronavirus COVID-19 to be a global pandemic on March 11, 2020, the world stands on the cusp of it replacing the Spanish Flu influenza pandemic of January 1918 to December 1920 as the reference point – the benchmark, as it were – for measuring modern pandemic plague. That will occur very shortly as the United States crosses the threshold of 675,000 COVID-19 deaths in what is now the novel coronavirus’ fourth wave there; a toll that will then exceed that of the Spanish Flu of a century ago in America.
All pretty remarkable, since the name COVID-19 didn’t exist prior to Feb. 11, 2020 when the World Health Organization named what had been provisionally known as Novel Coronavirus 2019-nCoV and first reported from Wuhan, China on Dec. 31, 2019. COVID-19 is caused by the SARS-CoV-2 virus.
It is important to note the “in America” qualification. As Laura Spinney writes in her very timely 2017 book, Pale Rider: The Spanish Flu of 1918 and How It Changed the World, our picture of the Spanish Flu pandemic, beginning in the waning last months of the First World War, just over a 100 years ago, is very much a reflection of the North American and European influenza pandemic perspective and experience, rather than that of say, India, South Africa or Iran, although the Spanish Flu, named not for its country of origin but rather because wartime press censorship was more relaxed in neutral Spain than either the Central Powers or Allied Powers in 1918, allowing for more early news coverage of the illness, which within months swept the world, much like COVID-19. While some 675,000 Americans died over three years between January 1918 and December 1920 during the three waves of the Spanish Flu pandemic, the country’s population was 103.2 million. Today, the population of the United States is more than 331 million. The world population in 1918 was about 1.8 billion, compared to about 7.8 billion people today.
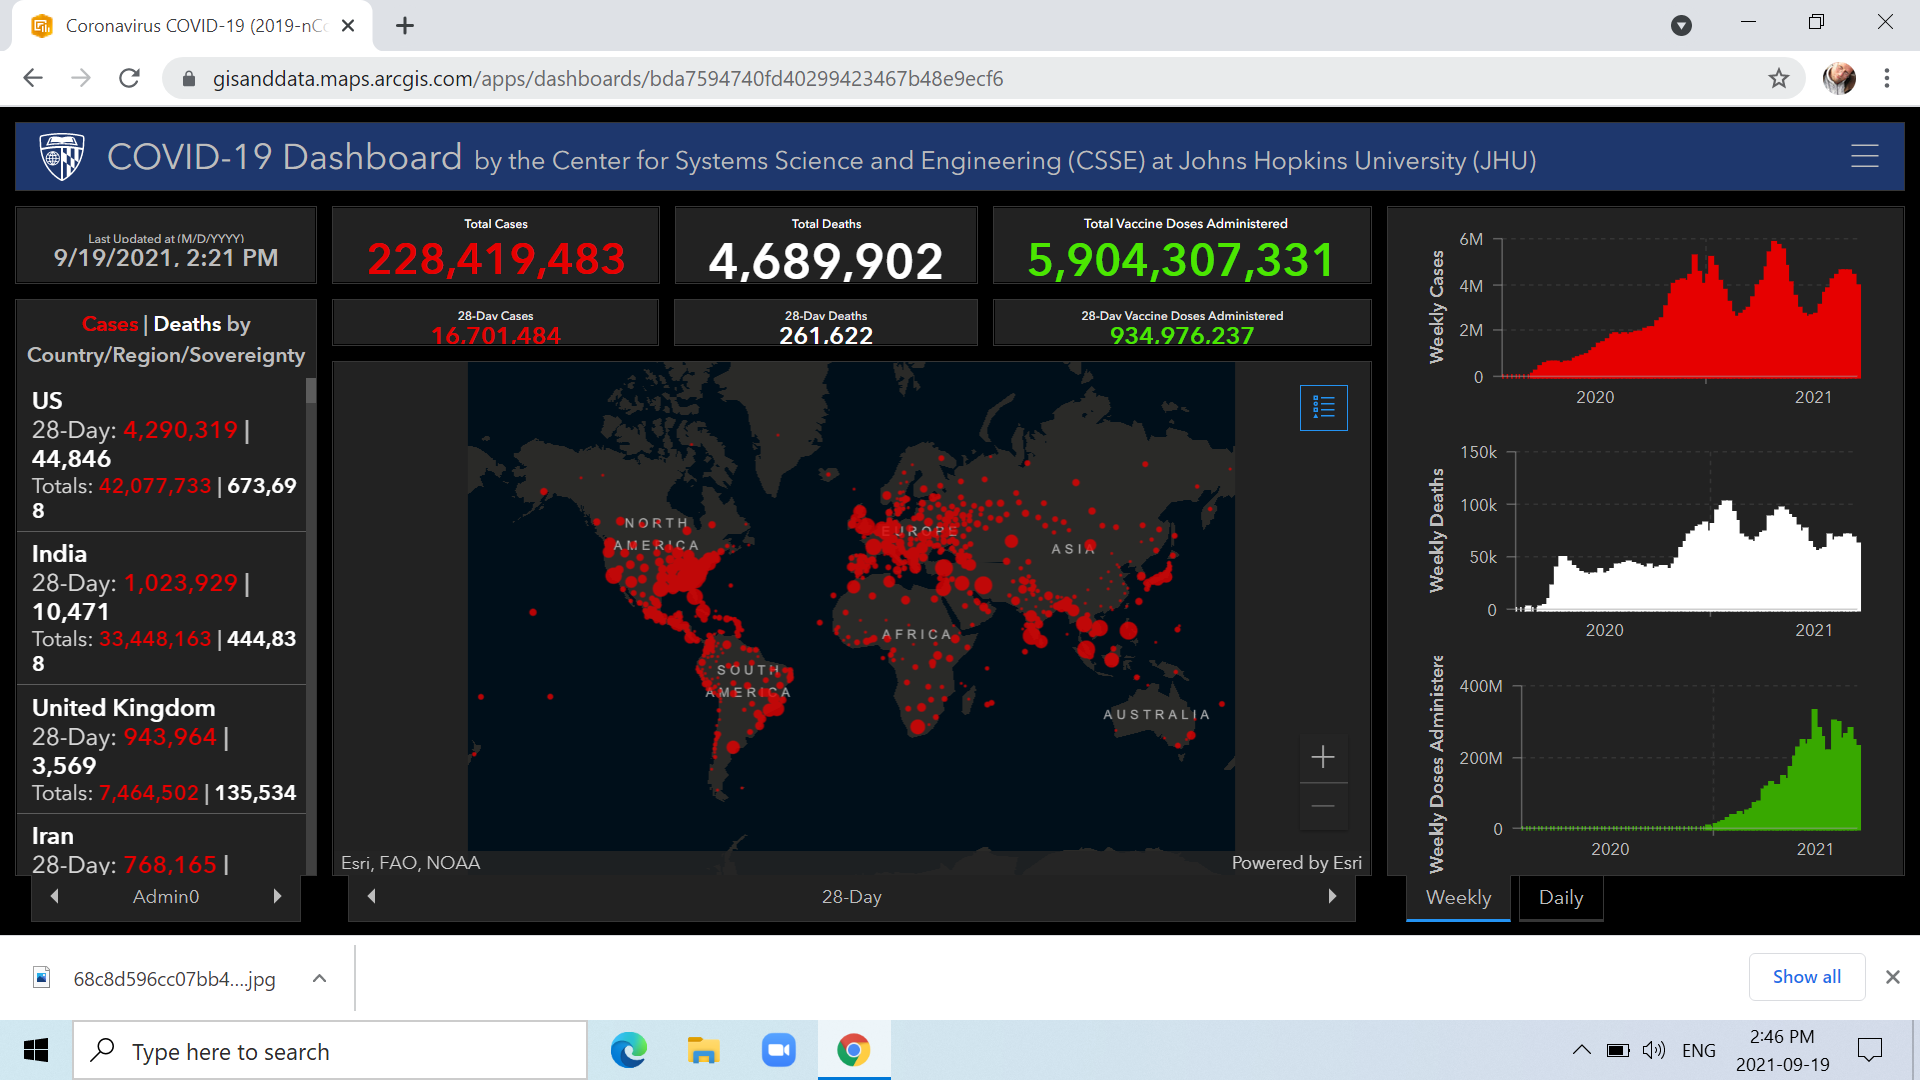
Also, while global death toll estimates for the Spanish Flu pandemic are speculative to some extent, it is generally accepted it killed somewhere between 50 and 100 million people worldwide. COVID-19’s global death toll stands at about 4.7 million.
There are, of course, all kinds of similarities – and differences – between COVID-19 and the Spanish Flu pandemic: They are not the same type of virus; the former is a coronavirus, the latter an influenza virus. But compulsory masking as a public health-driven non-pharmaceutical intervention (NPI) has been similarly divisive in societies in both pandemics. The rolling real time daily death count on the online COVID-19 Dashboard by the Center for Systems Science and Engineering (CSSE) at Johns Hopkins University (JHU) in Baltimore functions as our equivalent of the Bulletin of the Atomic Scientists’ “Doomsday Clock,” circa 1947, and the clock itself, set at 100 seconds before midnight last Jan. 27, is being profoundly influenced by COVID-19.
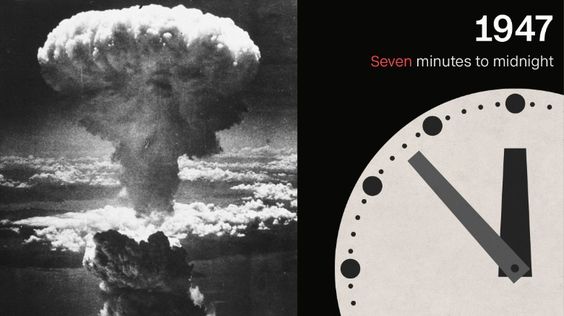
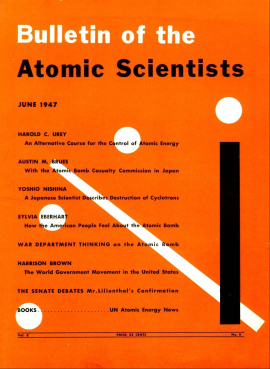
“Founded in 1945 by Albert Einstein and University of Chicago scientists who helped develop the first atomic weapons in the Manhattan Project, the Bulletin of the Atomic Scientists created the Doomsday Clock two years later, using the imagery of apocalypse (midnight) and the contemporary idiom of nuclear explosion (countdown to zero) to convey threats to humanity and the planet,” writes John Mecklin, the editor-in-chief. “The Doomsday Clock is set every year by the Bulletin’s Science and Security Board in consultation with its Board of Sponsors, which includes 13 Nobel laureates. The Clock has become a universally recognized indicator of the world’s vulnerability to catastrophe from nuclear weapons, climate change, and disruptive technologies in other domains.”
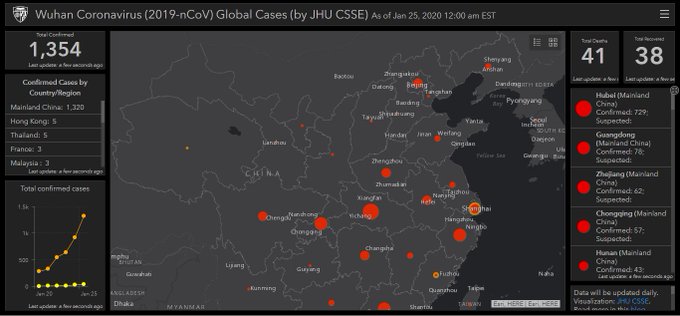
The Center for Systems Science and Engineering, in the Department of Civil and Systems Engineering in the Whiting School of Engineering at Johns Hopkins University’s Latrobe Hall in Baltimore, launched its a tracking map website with an online dashboard for tracking the worldwide spread of what was then known as the Wuhan coronavirus (2019-nCoV) as it appeared to be spreading around the globe in real-time in January 2020.
Lauren Gardner, a civil engineering professor and CSSE’s co-director, spearheaded the effort to launch the mapping website. The site displays statistics about deaths and confirmed cases of COVID-19 across a worldwide map.
“We built this dashboard because we think it is important for the public to have an understanding of the outbreak situation as it unfolds with transparent data sources,” Gardner said when Hopkins launches it last year. “For the research community, this data will become more valuable as we continue to collect it over time.”
You can also follow me on Twitter at: https://twitter.com/jwbarker22
