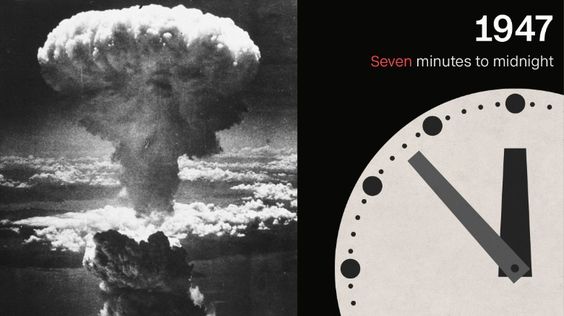
On Monday, Oct. 30, 1961, the largest nuclear weapon ever constructed was set off in an airburst test over Novaya Zemlya Island in the Russian Arctic Sea. The Soviet ‘Tsar Bomba’ had a yield of 50 megatons, or the power of around 3,800 Hiroshima bombs detonated simultaneously. The mushroom cloud from the Soviet detonation of “Tsar Bomba” was so large that the photographers had a hard time capturing its full dimensions.
A Tu-95V bomber was modified to carry the weapon, which was equipped with a special parachute that would slow its fall, allowing the plane to fly a safe distance from the blast. The aircraft, piloted by Andrey Durnovtsev, took off from the Kola Peninsula on October 30, 1961. It was joined by an observer plane. At approximately 11:32 a.m. Moscow time, Tsar Bomba was dropped over the Mityushikha Bay test site on the deserted island of Novaya Zemlya. It exploded about 2.5 miles (4 km) above the ground, producing a mushroom cloud more than 37 miles high; the flash of the detonation was seen some 620 miles away. The resulting damage was equally massive. Severny, an uninhabited village 34 miles from ground zero, was leveled, and buildings more than 100 miles away were reportedly damaged. In addition, it was estimated that heat from the blast would have caused third-degree burns up to 62 miles distant.
I lived on Church Street in Oshawa, Ontario. I was 4½ years old and riding my tricycle illicitly up to St. Gregory’s church, rectory, and school parking lot with my friend Paul Drumm, who lived around the corner on Elgin Street. We were usually scouring the pavement, a block or two from our home bases and stay-at-home moms, for cork-lined pop bottle caps, which sometimes listed prizes under the crumbly cork – a variation somewhat of Tim Hortons’ Roll Up the Rim to Win® coffee contest, introduced 25 years later in 1986, and which has become one of the world’s largest customer rewards programs.  In the early 1960s, pop bottle caps were still made of fluted metal with a natural cork liner that formed a seal on a glass bottle. Cork was phased out as a sealant in later in the decade.
Flash-forward to Oct. 27, 1962 – three days short of a year later. I was 5½ years old now in kindergarten and it would be more than a year still until JFK was assassinated in Dallas on Nov. 22, 1963.
“There was a chill in the air in Washington, D.C., at least for the mid-fall season, on that autumn Saturday. The high only made it up to 12°C ( 54°F) instead of the normal 18°C (64°F ) and a record low of -1 °C (30 °F) that still stands for the date was set in 1962.
“It was also Day 12 of the Cuban Missile Crisis. The Day on the Brink. The day that it almost all spun out of control…
“By Oct. 27, 1962, the United States Strategic Air Command (SAC), based at Offutt Air Force Base, Nebraska, had increased its readiness level to defcon 2 – one step short of nuclear war – and nearly 3,000 American nuclear warheads were aimed at targets in the Soviet Union. United States Air Force Maj. Rudolf Anderson Jr. was flying Mission 3127, his sixth foray over Cuba as part of Operation Brass Knob. Anderson was in his U-2 reconnaissance spy aircraft 14 miles sky-high at an altitude of about 72,000 feet. He had already made one pass over Cuba and was approaching the island shoreline when the Soviets, who had just selected American mainland targets and moved their nuclear-tipped cruise missiles to a firing position 15 miles from the U.S.-leased naval base at Guantánamo Bay, and fearful that Anderson’s mission would discover the fact, fired two SA-2 surface-to-air missiles (SAMs) at his U-2. One exploded behind Anderson and sent shrapnel into the cockpit, puncturing his pressure suit, probably killing him instantly. His U-2 broke apart, plummeted at least 60,000 feet, and crashed in Cuba…
“We can thank Vasili Alexandrovich Arkhipov for our date with doomsday dispensation on Oct, 27, 1962. The launch of the B-59’s nuclear torpedo required the consent of all three senior officers aboard. Arkhipov held the rank of captain and was aboard but not captaining B-59 that day. Savitsky was. But that still left Arkhipov as second-in-command. Rounding out the senior trio of executive officers was political officer Ivan Semonovich Maslennikov. While Savitsky and Maslennikov gave their consent to the submarine-based nuclear torpedo launch targeting the USS Randolf, Arkhipov, who died in 1998, refused, citing lack of confirmation that a nuclear war had started. He wanted B-59 to surface, which it did, refusing assistance from U.S. destroyers, and making its way slowly home to the Soviet Union.”
The final electronic link needed for pairs of land or sea-based missile operators to launch a nuclear strike is a row of randomly arranged numbers and letters for the Sealed Authenticator System code, one of the most closely-held secrets in the United States government, as the launch operators have to be confident that the emergency-action message actually comes from the President. The Air Force’s land-based Minuteman III missiles and the Navy’s submarine-based Trident II missiles require the eight-character Sealed Authenticator System code in order to be launched.
The National Security Agency produces the Sealed Authenticator System codes. Agency machines stamp the same computer-generated code of randomly arranged letters and numbers on two plastic cards. The machine then seals each card in a shiny metal foil. The code cards are nicknamed Sealed Authenticator System cookies because they look like wafer bars wrapped in tinfoil. The machine was specially built to do all the stamping and sealing itself, so no human eyes ever see the numbers and letters printed on the cards.
Some U.S. nuclear missiles are kept in a state of readiness that allows them to be launched within minutes after a decision to launch and are commonly said to be on “hair-trigger alert.” The military sometimes refers to this status as “high alert,” “ready alert,” “day-to-day alert,” “launch-on-warning status,” or “prompt-launch status.”
The exact number is classified, but experts estimate that the United States keeps a total of about 900 nuclear warheads on high alert. That estimate includes nearly all of the nation’s 450 long-range land-based missiles, each carrying one warhead, plus approximately 100 of its long-range submarine-based missiles, each carrying four or five warheads.
U.S. land-based missiles can be launched within five minutes of a presidential decision to do so, and submarine-based missiles within 15 minutes.
“We knew the world would not be the same,” said J. Robert Oppenheimer after witnessing the world’s first detonation of a nuclear weapon on July 16, 1945, when a plutonium implosion device was tested at a site located 210 miles south of Los Alamos, New Mexico, on the barren plains of the Alamogordo Bombing Range.
Oppenheimer was an American theoretical physicist. During the Manhattan Project, he was director of the Los Alamos Laboratory and responsible for the research and design of an atomic bomb. He is often known as the “father of the atomic bomb.” Said Oppenheimer after the blast: “A few people laughed, a few people cried, most people were silent. I remembered the line from the Hindu scripture, the Bhagavad-Gita. Vishnu is trying to persuade the Prince that he should do his duty and to impress him takes on his multi-armed form and says, “Now, I am become Death, the destroyer of worlds.” I suppose we all thought that one way or another.”
You can also follow me on Twitter at: https://twitter.com/jwbarker22